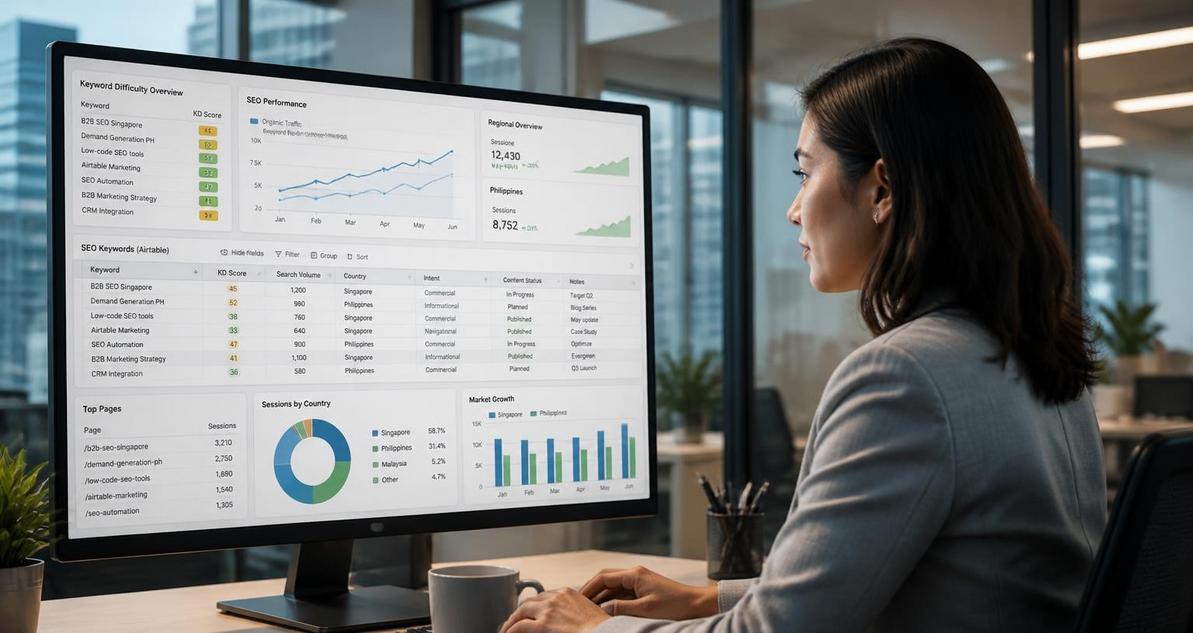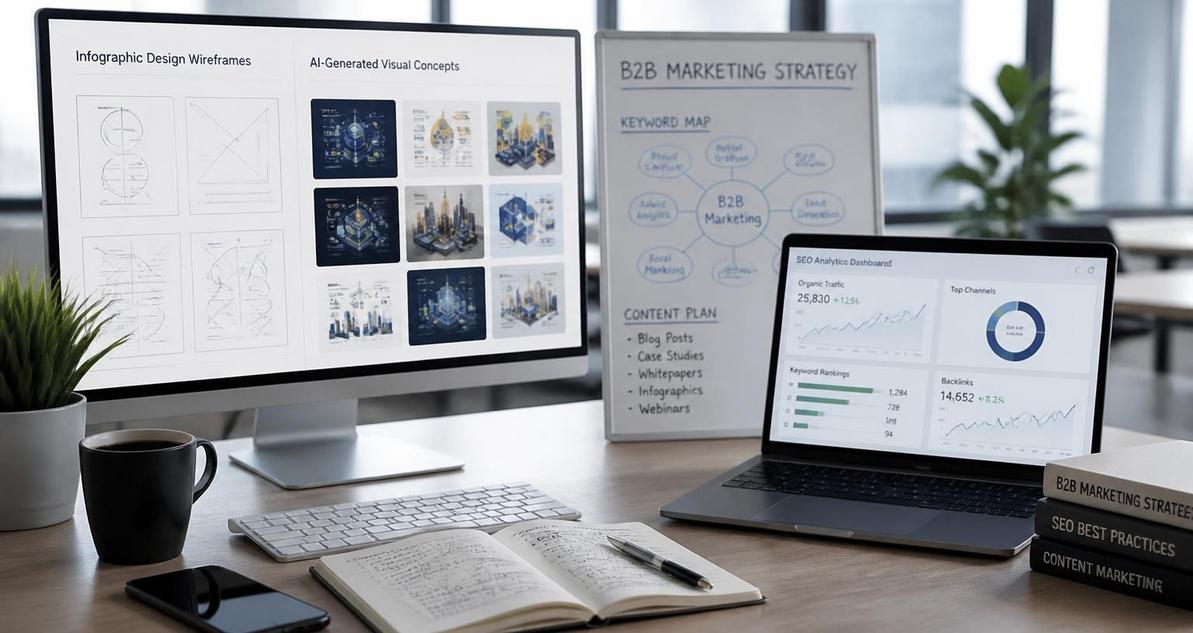
For brands competing in Singapore and the Philippines, infographic content still matters because it compresses research, positioning, and product value into a format that is easy to scan, share, and cite. The challenge is no longer whether to create infographics, but how to create them quickly enough, consistently enough, and with enough search relevance to support organic discovery. Midjourney and DALL-E 3 have changed that workflow by making concept generation, visual composition, and style exploration faster than traditional illustration pipelines. For B2B teams, especially in sectors like fintech, SaaS, logistics, and professional services, these tools can support content programs that need both speed and technical credibility.
Why SEO-Optimised Infographics Matter in B2B Content Operations
Infographics perform best when they solve a content problem, not when they simply decorate a page. Search engines reward pages that satisfy intent, and a strong infographic can improve dwell time, increase internal link engagement, and help a page attract backlinks from publishers, associations, and niche blogs. In Singapore and the Philippines, where B2B buyers often research vendors across multiple devices and through mobile-first browsing patterns, a well-structured visual asset can make dense technical material easier to consume.
From an SEO perspective, the infographic should be treated as part of a content cluster, not as a standalone image. That means the surrounding copy must target semantically related queries, the filename should be descriptive, the alt text must accurately describe the image, and the page should include supporting text that contextualises the visual. Search engines cannot interpret an infographic the same way a human does, so the surrounding HTML becomes the primary source of relevance. If your page is about cloud migration readiness, for example, the infographic should reinforce a cluster around migration planning, risk assessment, cost control, governance, and implementation steps.
For B2B teams, this also improves content repurposing efficiency. The same visual can be used in a blog article, a sales deck, a webinar follow-up email, a LinkedIn carousel, or a gated lead magnet. That matters in markets where lean marketing teams often need to support both demand generation and executive education with limited production resources. AI-assisted design tools reduce the time required to test concepts, but the SEO result still depends on editorial discipline and information architecture.
How Midjourney and DALL-E 3 Differ for Infographic Production
Midjourney and DALL-E 3 can both support infographic creation, but they serve different parts of the workflow. Midjourney is strong for artistic direction, stylised compositions, mood boards, and highly polished visuals. DALL-E 3 is generally better for prompt adherence, textual interpretation, and concept fidelity. For SEO-optimised infographics, this distinction matters because the final asset needs to communicate structured information clearly, not just look attractive.
Midjourney for Visual Direction and Brand Style Exploration
Midjourney is useful when the marketing team wants to define a visual system before final production. It can generate thematic imagery, iconographic scenes, abstract process diagrams, and brand-aligned mood references. For example, if you are building an infographic about cybersecurity maturity, Midjourney can help generate a visual language that feels technical, modern, and trustworthy. That visual language can then inform the palette, icon style, and composition used in the final infographic.
Midjourney works best when prompts specify composition, lighting, color palette, aspect ratio, and stylistic references. A prompt such as “clean corporate infographic layout, flat vector style, blue and teal palette, high contrast, modular data panels, business technology theme, white background” gives more predictable results than a vague request. For B2B use cases, control is important because overly artistic output can reduce legibility and weaken the information hierarchy.
DALL-E 3 for Structured Concepts and Prompt Fidelity
DALL-E 3 is particularly helpful when the infographic needs specific iconography, straightforward scene composition, or text-aware conceptual layouts. While neither tool should be relied on to render final editorial typography directly, DALL-E 3 is often better when the prompt includes detailed content relationships such as “three-step workflow,” “comparison matrix,” or “timeline with milestones.” That makes it useful for concept mockups, section headers, and supporting visuals that will later be rebuilt in a design tool.
For SEO content teams, DALL-E 3 also supports ideation for data narratives. If you are writing about omnichannel attribution, customer journey mapping, or process automation, you can prompt for diagrams that reflect the logic of the article. The output may not be production-ready, but it can shorten the creative brief and align stakeholders before design begins. This reduces revision cycles, which is especially valuable when content teams coordinate across strategy, design, and subject matter experts.
Building an SEO-Ready Infographic Workflow
An effective workflow starts with keyword research and content mapping, not image generation. The infographic should answer a query that already has search demand or support a topic cluster where the brand wants authority. Once the topic is selected, the next step is to define the primary search intent, the supporting questions, and the exact narrative that the visual must reinforce. The more precise the brief, the more usable the AI-generated concept will be.
A practical workflow for B2B teams looks like this: identify the target keyword, define related entities and subtopics, create a content outline, generate visual concepts with AI, refine the best concept in a design tool, and then publish the infographic within a fully optimised article page. This process keeps the creative output aligned with the page’s informational architecture. It also avoids the common mistake of designing an image first and forcing content around it later.
Step 1: Map the Query to a Visual Narrative
Start by deciding what the user should learn from the infographic in one scan. If the keyword is “enterprise SEO audit checklist,” the visual might show a sequence of audit stages, associated deliverables, and priority levels. If the keyword is “marketing automation architecture,” the infographic might show platform layers, data flow, and activation points. A strong visual narrative usually follows one of three models: process, comparison, or framework.
From an SEO standpoint, this step improves topical consistency. When the image mirrors the article structure, the page becomes easier to skim and more likely to satisfy search intent. That alignment also helps content teams create better internal links, because each section can point to a related guide, case study, or service page.
Step 2: Write Prompts That Reflect Design Constraints
Prompt engineering matters because the model needs enough specificity to produce a usable composition. Include the intended aspect ratio, layout style, number of visual zones, and brand tone. For example, a prompt for Midjourney could be: “modern B2B infographic, 16:9 aspect ratio, five modular panels, clean grid, vector style, muted blue and green accents, fintech theme, high clarity, minimal clutter, presentation-ready.”
For DALL-E 3, the prompt can be more explicit about content structure. You might request “a three-part diagram showing input, processing, and output, with a central data pipeline and supporting labels as blank blocks for later editing.” This approach avoids depending on AI to render exact final text, which remains unreliable in most image generation tools. Treat the AI output as a concept frame, not the final deliverable.
Step 3: Rebuild the Asset for Readability and Brand Control
After generating the concept, recreate the infographic in Figma, Adobe Illustrator, Canva, or another design tool that supports precise typography and layout control. This step is critical because SEO infographics must be readable on desktop and mobile, and AI image generators still struggle with crisp text, alignment, and fine-grained spacing. The production version should use real fonts, consistent iconography, and a clear hierarchy of headings, labels, and callouts.
At this stage, the design team should also optimise the export settings. Use compressed file sizes, descriptive filenames, and web-friendly formats such as SVG when the design is vector-based, or compressed PNG and WebP for raster assets. A file named “enterprise-seo-audit-checklist-singapore.png” is significantly more useful than “image123.png” because it supports image SEO and internal asset governance.
Technical SEO Requirements for Infographic Pages
The infographic itself is only one part of the SEO equation. The page where it lives must support indexation, accessibility, and semantic relevance. Without those components, the visual may earn engagement on social channels but contribute little to organic search. Technical SEO turns the asset into a searchable content product.
First, ensure the page includes enough supporting copy to explain the infographic. Search engines need context, and users need a textual version of the information if they cannot view the visual clearly. This is particularly important in mobile-heavy markets like the Philippines, where bandwidth limitations can still affect loading behaviour. The page should include an introduction, a detailed explanation of each section of the infographic, and internal links to related resources.
Second, write alt text that describes the content accurately and naturally. Avoid keyword stuffing. Good alt text explains what the image shows and why it matters in the article. For example, “Infographic showing a five-step enterprise SEO audit framework, including crawl analysis, content evaluation, technical fixes, internal linking, and reporting.” That description is specific, useful, and aligned with accessibility guidelines.
Third, implement structured content around the infographic. Headings should reflect the same conceptual hierarchy used in the image. If the infographic contains stages, the article should use matching subheads. If it compares options, the article should use a comparison table or paragraph structure that mirrors the comparison. This consistency strengthens topical relevance and improves user comprehension.
Schema, Accessibility, and Indexation
While image schema is not a direct ranking lever in the way many marketers hope, structured data still helps search engines understand page context. Use Article schema, and if the page includes FAQ content or other eligible sections, apply schema where appropriate and compliant. Pair this with strong accessibility practices such as sufficient contrast, semantic headings, and text alternatives. Accessibility is not separate from SEO in practice, because both depend on clarity, structure, and machine-readable content.
Also verify that the page loads quickly. Heavy infographic files can damage Core Web Vitals, particularly on slower mobile connections. Compress images, lazy-load below-the-fold assets, and avoid stacking multiple oversized graphics on a single page. A visually impressive page that loads slowly can undermine both rankings and conversions.
Practical Use Cases for Singapore and Philippines B2B Teams
In Singapore, where many firms compete on expertise, trust, and regulatory awareness, infographics work well for subjects such as cybersecurity governance, fintech compliance, supply chain digitisation, and enterprise software adoption. In the Philippines, where business growth often depends on service differentiation and scalable operations, infographics are effective for outsourcing, customer experience, digital transformation, and SME enablement. In both markets, the audience tends to value clarity, operational relevance, and proof of competence.
A consulting firm could use Midjourney to explore a visual concept for “digital transformation readiness,” then rebuild the selected concept in Figma and publish it within a long-form guide. A SaaS company could use DALL-E 3 to prototype a “workflow automation architecture” graphic, then refine it into a gated asset for lead capture. A financial services brand could create an infographic that breaks down a risk management model into sections that align with the company’s service pages and educational blog series. These examples all rely on the same principle: the visual must support a measurable content objective.
Data-driven decision making is also important here. Track impressions, organic clicks, scroll depth, click-through from the article to service pages, and assisted conversions. If an infographic page attracts backlinks or outperforms text-only articles on engagement metrics, that is a signal worth scaling. If it receives traffic but no meaningful interaction, the visual may be attractive but not aligned to intent.
Implementation Checklist for an SEO-Optimised Infographic Workflow
- Choose a keyword that has clear search intent and a content cluster around it.
- Define the infographic objective before generating any AI imagery.
- Use Midjourney for style exploration and DALL-E 3 for structured concept drafts.
- Rebuild the final infographic in a design tool with exact typography and spacing control.
- Export in web-optimised formats and use descriptive filenames.
- Write precise alt text and place the infographic within relevant surrounding copy.
- Align headings, internal links, and page sections with the visual structure.
- Test mobile readability, load speed, and accessibility contrast before publishing.
- Track organic engagement, backlinks, and conversion impact after launch.
- Repurpose the same asset across blog, email, social, and sales enablement channels.

I am Tricia Huang Mei, an Advertising Partner in Sotavento Medios with over two decades of experience in the Singapore advertising and business sectors. My career is defined by a commitment to driving high-impact marketing campaigns and fostering sustainable growth for the diverse business portfolios I manage.